Find Unused JavaScript And CSS With The Coverage Tab
The Coverage tab in Chrome DevTools can help you find unused JavaScript and CSS code. Removing unused code can speed up your page load and save your mobile users cellular data.

A word of warning. Finding unused code is relatively easy. But refactoring a codebase so that each page only ships the JavaScript and CSS that it needs can be difficult. This guide doesn’t cover how to refactor a codebase to avoid unused code because these refactors depend highly on your technology stack.
Overview
Shipping unused JavaScript or CSS is a common problem in web development. For example, suppose that you want to use Bootstrap’s button component on your page. To use the button component you need to add a link to Bootstrap’s stylesheet in your HTML, like this:
|
1 2 3 4 5 6 7 8 9 10 |
... <head> ... <link rel="stylesheet" href="https://stackpath.bootstrapcdn.com/bootstrap/4.3.1/css/bootstrap.min.css" integrity="sha384-ggOyR0iXCbMQv3Xipma34MD+dH/1fQ784/j6cY/iJTQUOhcWr7x9JvoRxT2MZw1T" crossorigin="anonymous"> ... </head> ... |
This stylesheet doesn’t just include the code for the button component. It contains the CSS for all of Bootstrap’s components. But you’re not using any of the other Bootstrap components. So your page is downloading a bunch of CSS that it doesn’t need. This extra CSS is a problem for the following reasons:
- The extra code slows down your page load. See Render-Blocking CSS.
- If a user accesses the page on a mobile device, the extra code uses up their cellular data.
Open the Coverage tab
- Open the Command Menu.
- Start typing
coverage, select the Show Coverage command, and then press Enter to run the command. The Coverage tab opens in the Drawer.

Record code coverage
- Click one of the following buttons in the Coverage tab:
- Click Start Instrumenting Coverage And Reload Page
 if you want to see what code is needed to load the page.
 - Click Instrument Coverage if you want to see what code is used after interacting with the page.
- Click Start Instrumenting Coverage And Reload Page
- Click Stop Instrumenting Coverage And Show Results when you want to stop recording code coverage.
Analyze code coverage
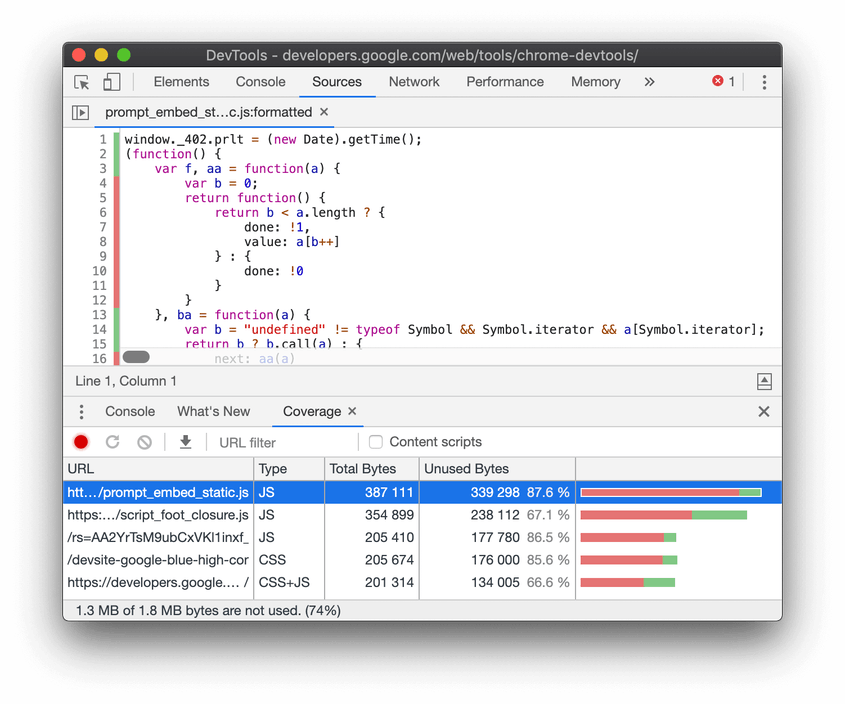
The table in the Coverage tab shows you what resources were analyzed, and how much code is used within each resource. Click a row to open that resource in the Sources panel and see a line-by-line breakdown of used code and unused code.
- The URL column is the URL of the resource that was analyzed.
- The Type column says whether the resource contains CSS, JavaScript, or both.
- The Total Bytes column is the total size of the resource in bytes.
- The Unused Bytes column is the number of bytes that weren’t used.
- The last, unnamed column is a visualization of the Total Bytes and Unused Bytes columns. The red section of the bar is unused bytes. The green section is used bytes.
Napsat komentář